
This one scroll will be a bit different. It's just brief introduction, results and some heavy discussion of the results.
Well oh well what are we doing here? We're attempting to model the atmosphere such that we can land safely. One of the most important things you need to know about the atmosphere is simply what is it composed of. This is exactly what we'll be doing here. One way to do this is to look at the spectral lines of gasses, and compare then to the spectral lines/dips that we expect them to have. Every gas has a different spectral profile and our instruments are shitty because they let in a lot of noise, that's it, that's the challenge.
We used the chi minimization to minimize this function
\(F(F_{\text{min}},\lambda_0,\sigma)=1+(F_{\text{min}}-1)\ \mathrm{exp} \left[ -\left(\dfrac{\lambda - \lambda_0}{\sqrt{2}\sigma} \right) ^2 \right]\)
In other words, finding parameters that minimize the difference between the discrete data we're given and a set of parameters for the real function that ought to reproduce the discrete data without the noise
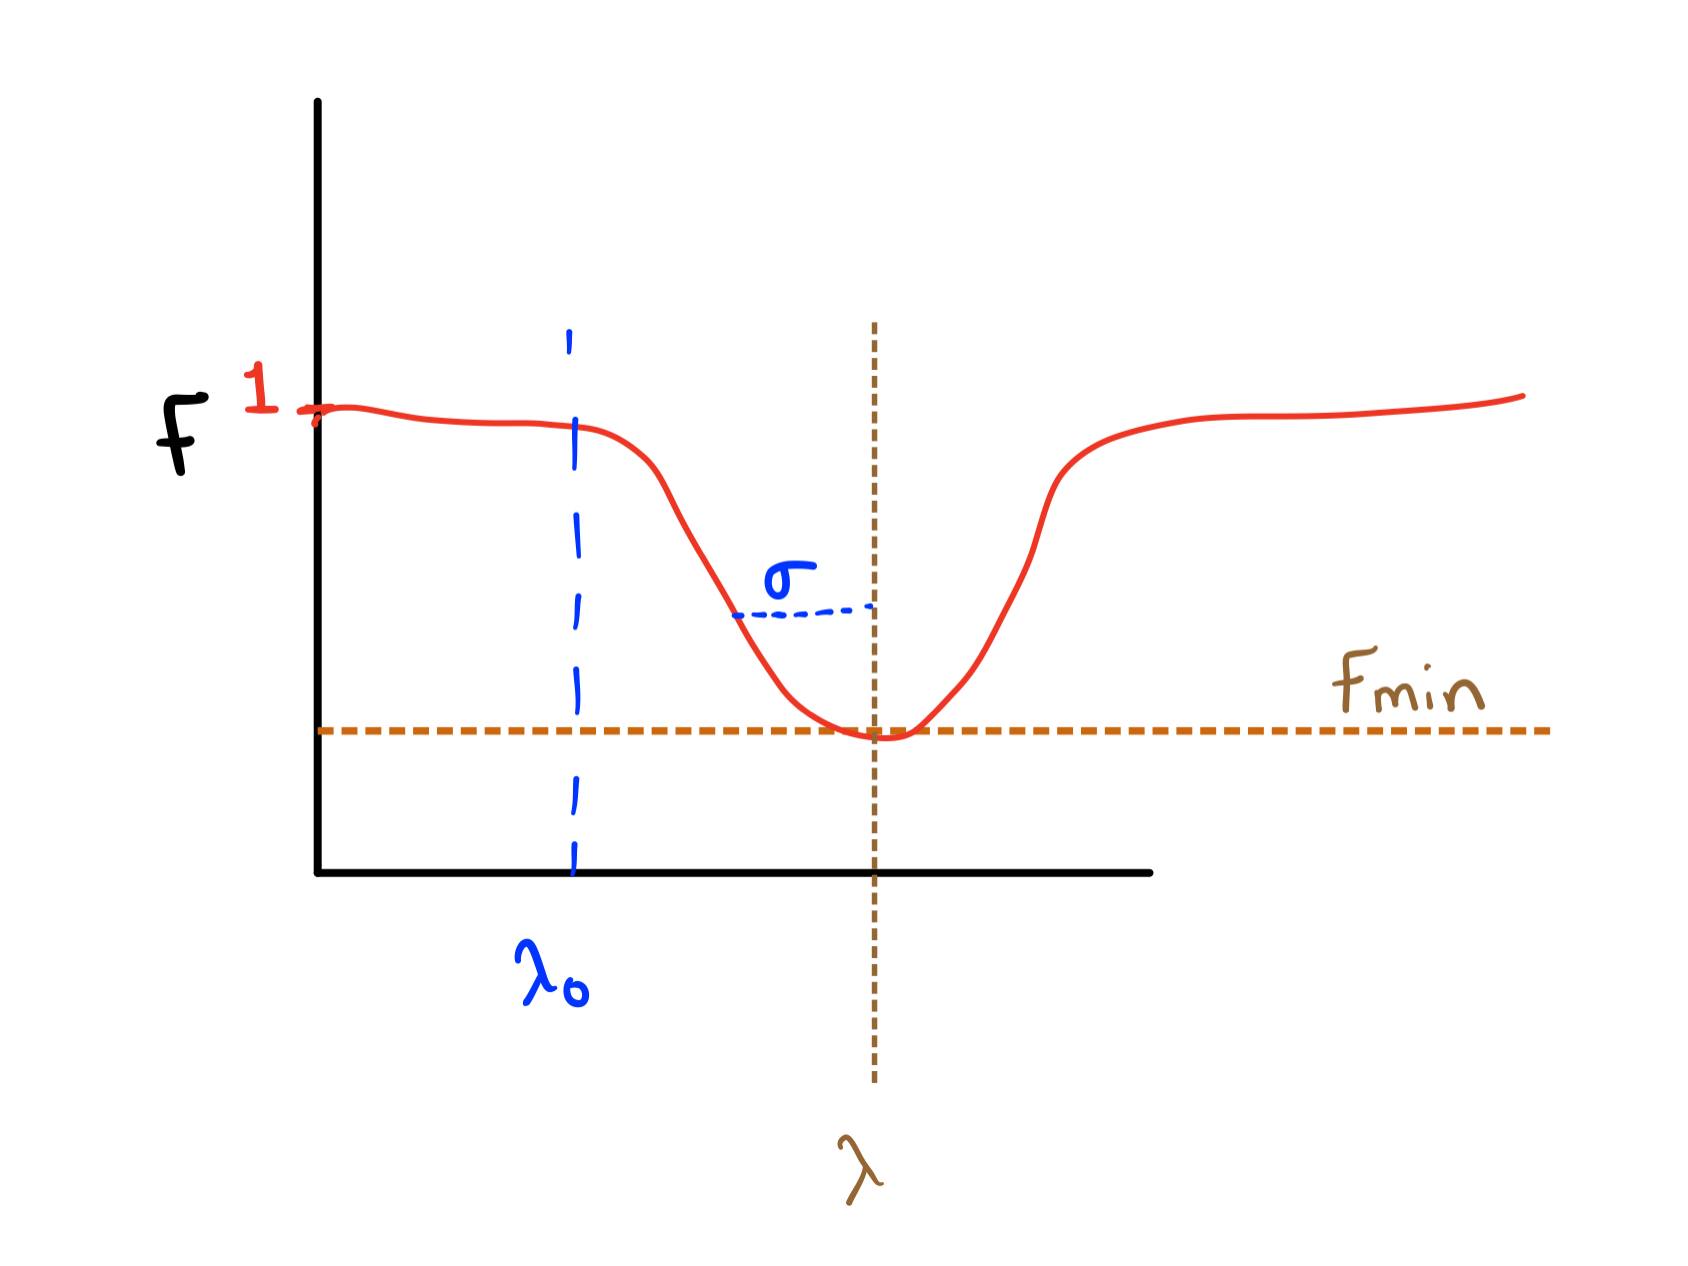
We have normalized the graph such that when there is no absorption we have F = 1, that's why most of the lines will be a straight line about one.
Here is an example of one of the plots we obtained.
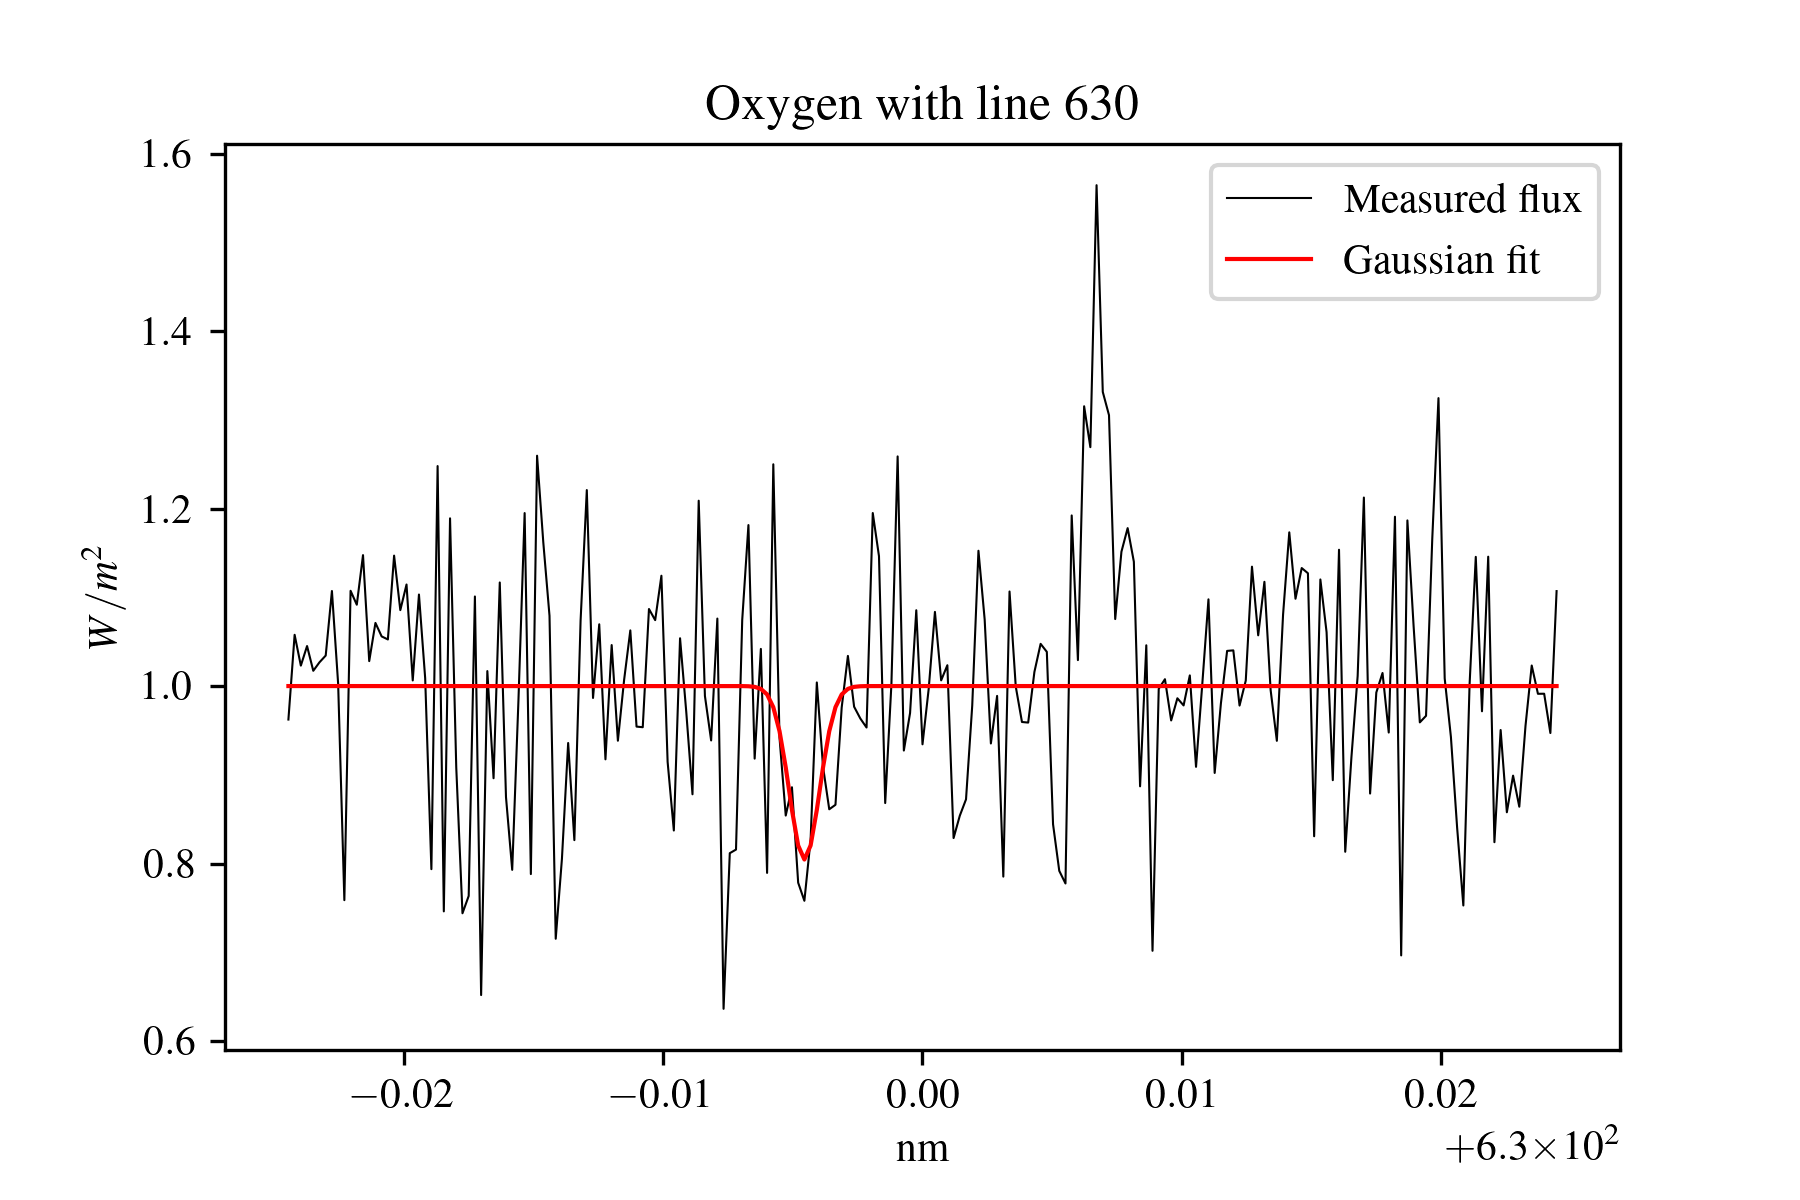
First thing we note, is that the dip is wide, ideally speaking this should look like a straight line dip, but that is not possible when you have so much noise. In addition the plot's x-axis spans a very small 0.04 nm, so that makes the dip look even wider.
But yes, this is how it looks like
We have some guiding principles, and pay attention to their numbering now as I will call them by number.
- The Doppler shifts are expected to be the same for each gas, we are using the same spectrograph which is moving at the same relative speed with respect to the gas particles, however noise makes it more or less harder to see. We have a max doppler shift that we know we can't go over, \(\frac{\Delta \lambda_{\mathrm{max}} }{\lambda_0}=\frac{v_{\mathrm{max}}}{c}\), which is just \(\Delta \lambda_{\mathrm{max}}=\frac{v_{\mathrm{max}}}{c}\lambda_0\), this allows us to cut our calculations by considering only these boundaries when we're looking for dips.
- Real spectral lines tend to have lower minimum Flux values than the consistent statistical flukes. This means we should look at the graph and see if the F_min is barely a minimum, as in it looks like a smaller dip than the majority of the statistical flukes (only the consistent ones.
- Finding one spectral line of a gas is enough. We don't need each spectral line of oxygen for there to be oxygen for example, one spectral line is enough.
- Different spectral lines from the same gas will have the same temperature, however that noise distorts the numbers a bit.
- Minimum F is expected to be less that 0.7, however noise could make this fluctuate a bit so we're taking this range instead [0.5,0.85]. This is just a range, we might make some exceptions.
- The atmospheric temperature T is expected to be somewhere in the range [150,450]K, however, I know the surface temperature of my planet and I'm inclined to use that as a measure as well.
Having mentioned that, we will now present the table of the results and mark the values that are within our establish boundaries with light green, the ones that barely make is as dark red and the unmarked ones are disqualified, for now. Because I will be using the surface temperature as a gauge, in this one.
.jpg)
Looking at all the rows with 3 good values, we get Nitrous oxide, Carbon Dioxide and Water vapor, however I'm torn apart between surface temperature and the whole planet's gas temperature, that is, between the craft and the surface. Looking at the whole planet's temperature we then must include all the other temperatures, and then we would get a more interesting table, where all the temperatures go. That's how it would look like:
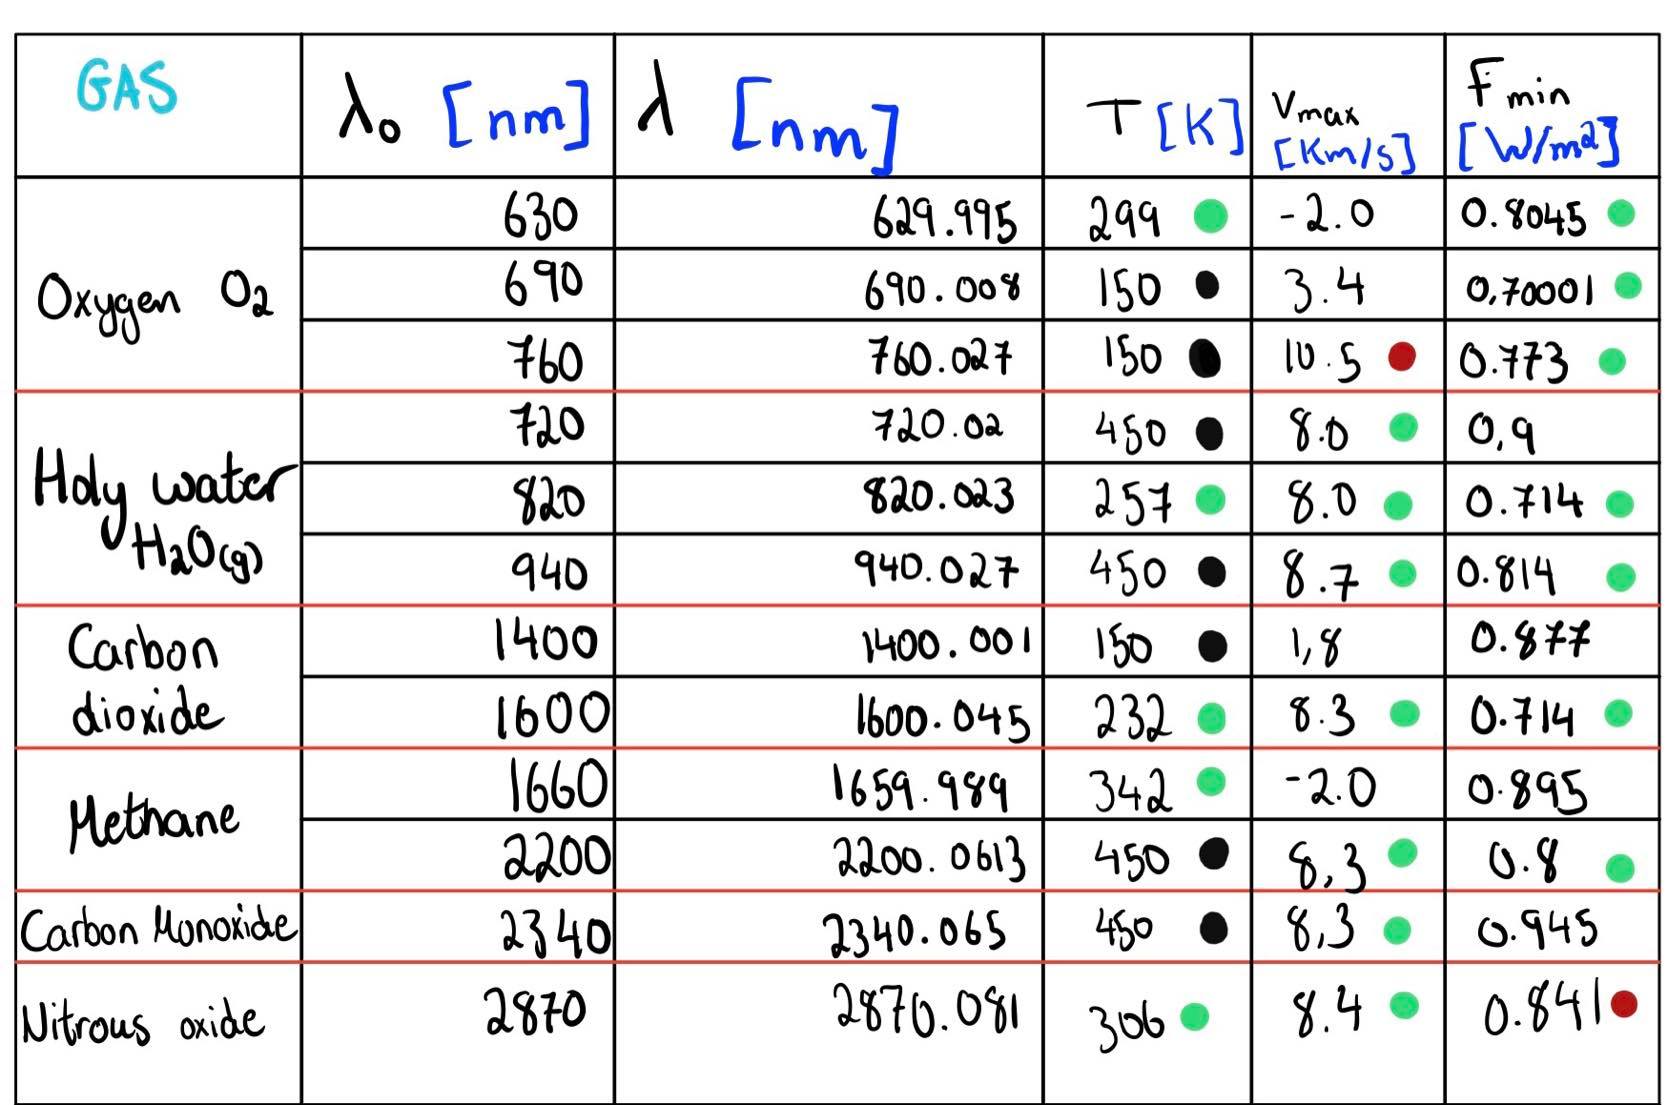
In that case, Methane is included and Oxygen is also included along with the other ones already mentioned. But let's talk about something here, do you see why on the max velocity column we have green dots where we have them? For example Oxygen 690 nm is disqualified, why is that? Take a look at our assumptions again.
The reason is that we know as mentioned The Doppler shifts are expected to be the same for each gas, we are using the same spectrograph which is moving at the same relative speed with respect to the gas particles. This means that all the gases that are actually there are expected to have around the same Doppler shift, perhaps even \(\pm2\) km/s from the true Doppler shift.
But how do we determine the true Doppler shift? We must find some other metric that can help us distinguish real from fake, that metric is the minimum flux, or the dip. The lesser the minimum flux the better, let's look at the table and check out the minimum flux values less than 0.800 W/m^2, we have 4 and 3 out of those correspond to a max velocity of around 8 km/s, even more if we look at the average of all these values ((-2+3.4+10.5+8+8+8.8+1.8+8.3-2+8.3+8.3+8.4)/12) we get 5.8 km/s which is quite close to 8 km/s given that we have a large amount of noise.
I believe that the max velocity has the most most importance here for a couple of reasons:
- The range [-10,10] is rather large which means there's less room for consistent values to be similar.
- The fact that all gases shall have more or less the same Doppler shift means we can combine it with the point above.
Because what are the chances that noise gives 7-8 values around one number (8), when the range includes 20 different whole numbers? So the verdict will be skewed to the spectral lines with the least minimum flux and a max velocity close to the value determined above. W will look at each gas and qualify or disqualify, lessgo!
Oxygen
Looking at the third spectral line, we see reasonable temperature we see very low F value, BUT the velocity is even over our range, however our range is for the real thing, as in, it wasn't made while taking into account the noise, so can allow it, though we could've definitely been stricter. We have already mentioned that if one spectral line matches, then the gas is in, not all spectral lines have to be verivied.png)
OXYGEN YOU PASS, BARELY!
Water vapor
Do I even need to say anything? These values are perfect! (speaking of the second spectral line), low Flux value, good max velocity, almost exactly the temperature of our planet.png)
YOU SILLY SILLY GOOSE H2O, TRULY ICONIC, YOU PASS WITH FLYING COLORS!!!!
Carbon Dioxide and Methane
This is just good stuff, These values are good! (speaking of the second spectral lines for both gases), low Flux value, good max velocity, acceptable temperatures.
.png)
.png) YOU SILLY SILLY GREEN HOUSE EFFECT GASSES, JOIN THE CREW !!!!
YOU SILLY SILLY GREEN HOUSE EFFECT GASSES, JOIN THE CREW !!!!
Carbon Monoxide and Nitrous Oxide
VERY good sutff on the temperature and the velocity front, but I have to be harsh here and say that CO's 0.945 is way too high a flux, it's simply too close the normalized line y =1, as for the flux of the Nitrous Oxide? It is very close, almost too close to call but someone has to make decisions around here:
Nitrous and Carbon Monoxide, you are NOT the father.
.png)
.png)
THIS IS THE MAIN RESULT:
So the composition of our atmosphere is thus Oxygen, Water vapor, Carbon Dioxide and Methane. Nitrous Oxide was this close but didn't make it. So we have 25% of each.
Time for some boring discussion of the results.
Are my results sensible and consistent?
Yes, or maybe not, we have expected values and the values we observed, there is not much more we can do. Part of the task was making sure that the numbers are consistent (for example the max velocity being around 8 km/h most likely. The data given to us is from the spacecraft itself and that's something we can't do much about, however our results have been influenced by guesswork and probability, and that's how it really is, it is really difficult to be 100% sure without better equipment and better methods, perhaps more complex ones. The good news though, is that it won't affect our landing too much even if we messed up on a couple of the gasses, given that we will calculate the mean molecular point.
What could we do for better results?
First of all, include more gasses and their spectral lines, gasses such as Helium and pure Nitrogen. Secondly, we could increase the number of values we would test for each parameter in our flux function, we used 100x100x(205 to 914), however that would just take too much time to run, but we can try! 0.8045454545454546 is the value we got for Oxygen 630, now we'll run the program for 200x200x205. I've been waiting for half an hour now, I'm getting a bit bored If I'm being honest. It finally ran, and we got this value for flux 0.805210420841683. Calculating relative error:
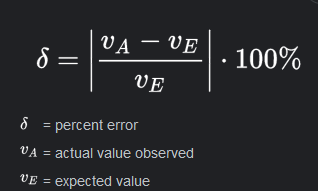
We get approximately 0.08%, we're not missing out on that much accuracy.
One way we could get better results is by using our actual velocity instead of using vague ranges, because then we would be able to define better limits and expect one specific consistent Doppler shift, perhaps even reduce our velocity as much as possible without entering the atmosphere then using that.
The load is dropped. Up next we have modeling the atmosphere.