
You've heard about the flat earth theory? Yes, bullshit.
Karl: LANGUAGE
Rebecca: Sorry
The title was in fact a clickbait. However, the closest we get to a flat earth is maybe a photo of it.
Anyways, let me introduce this topic through a scenario. You want a waffle. You get waffle batter. This is not exactly what you wanted, BUT you can make it into what you wanted. You use a waffle machine and cook the batter. Tada! A waffle! This is what we are doing today, just not with waffles... but with photos :)
Todays topic is stereographic projection. A important part when developing a navigation software for our spacecraft. Let me walk you through it.
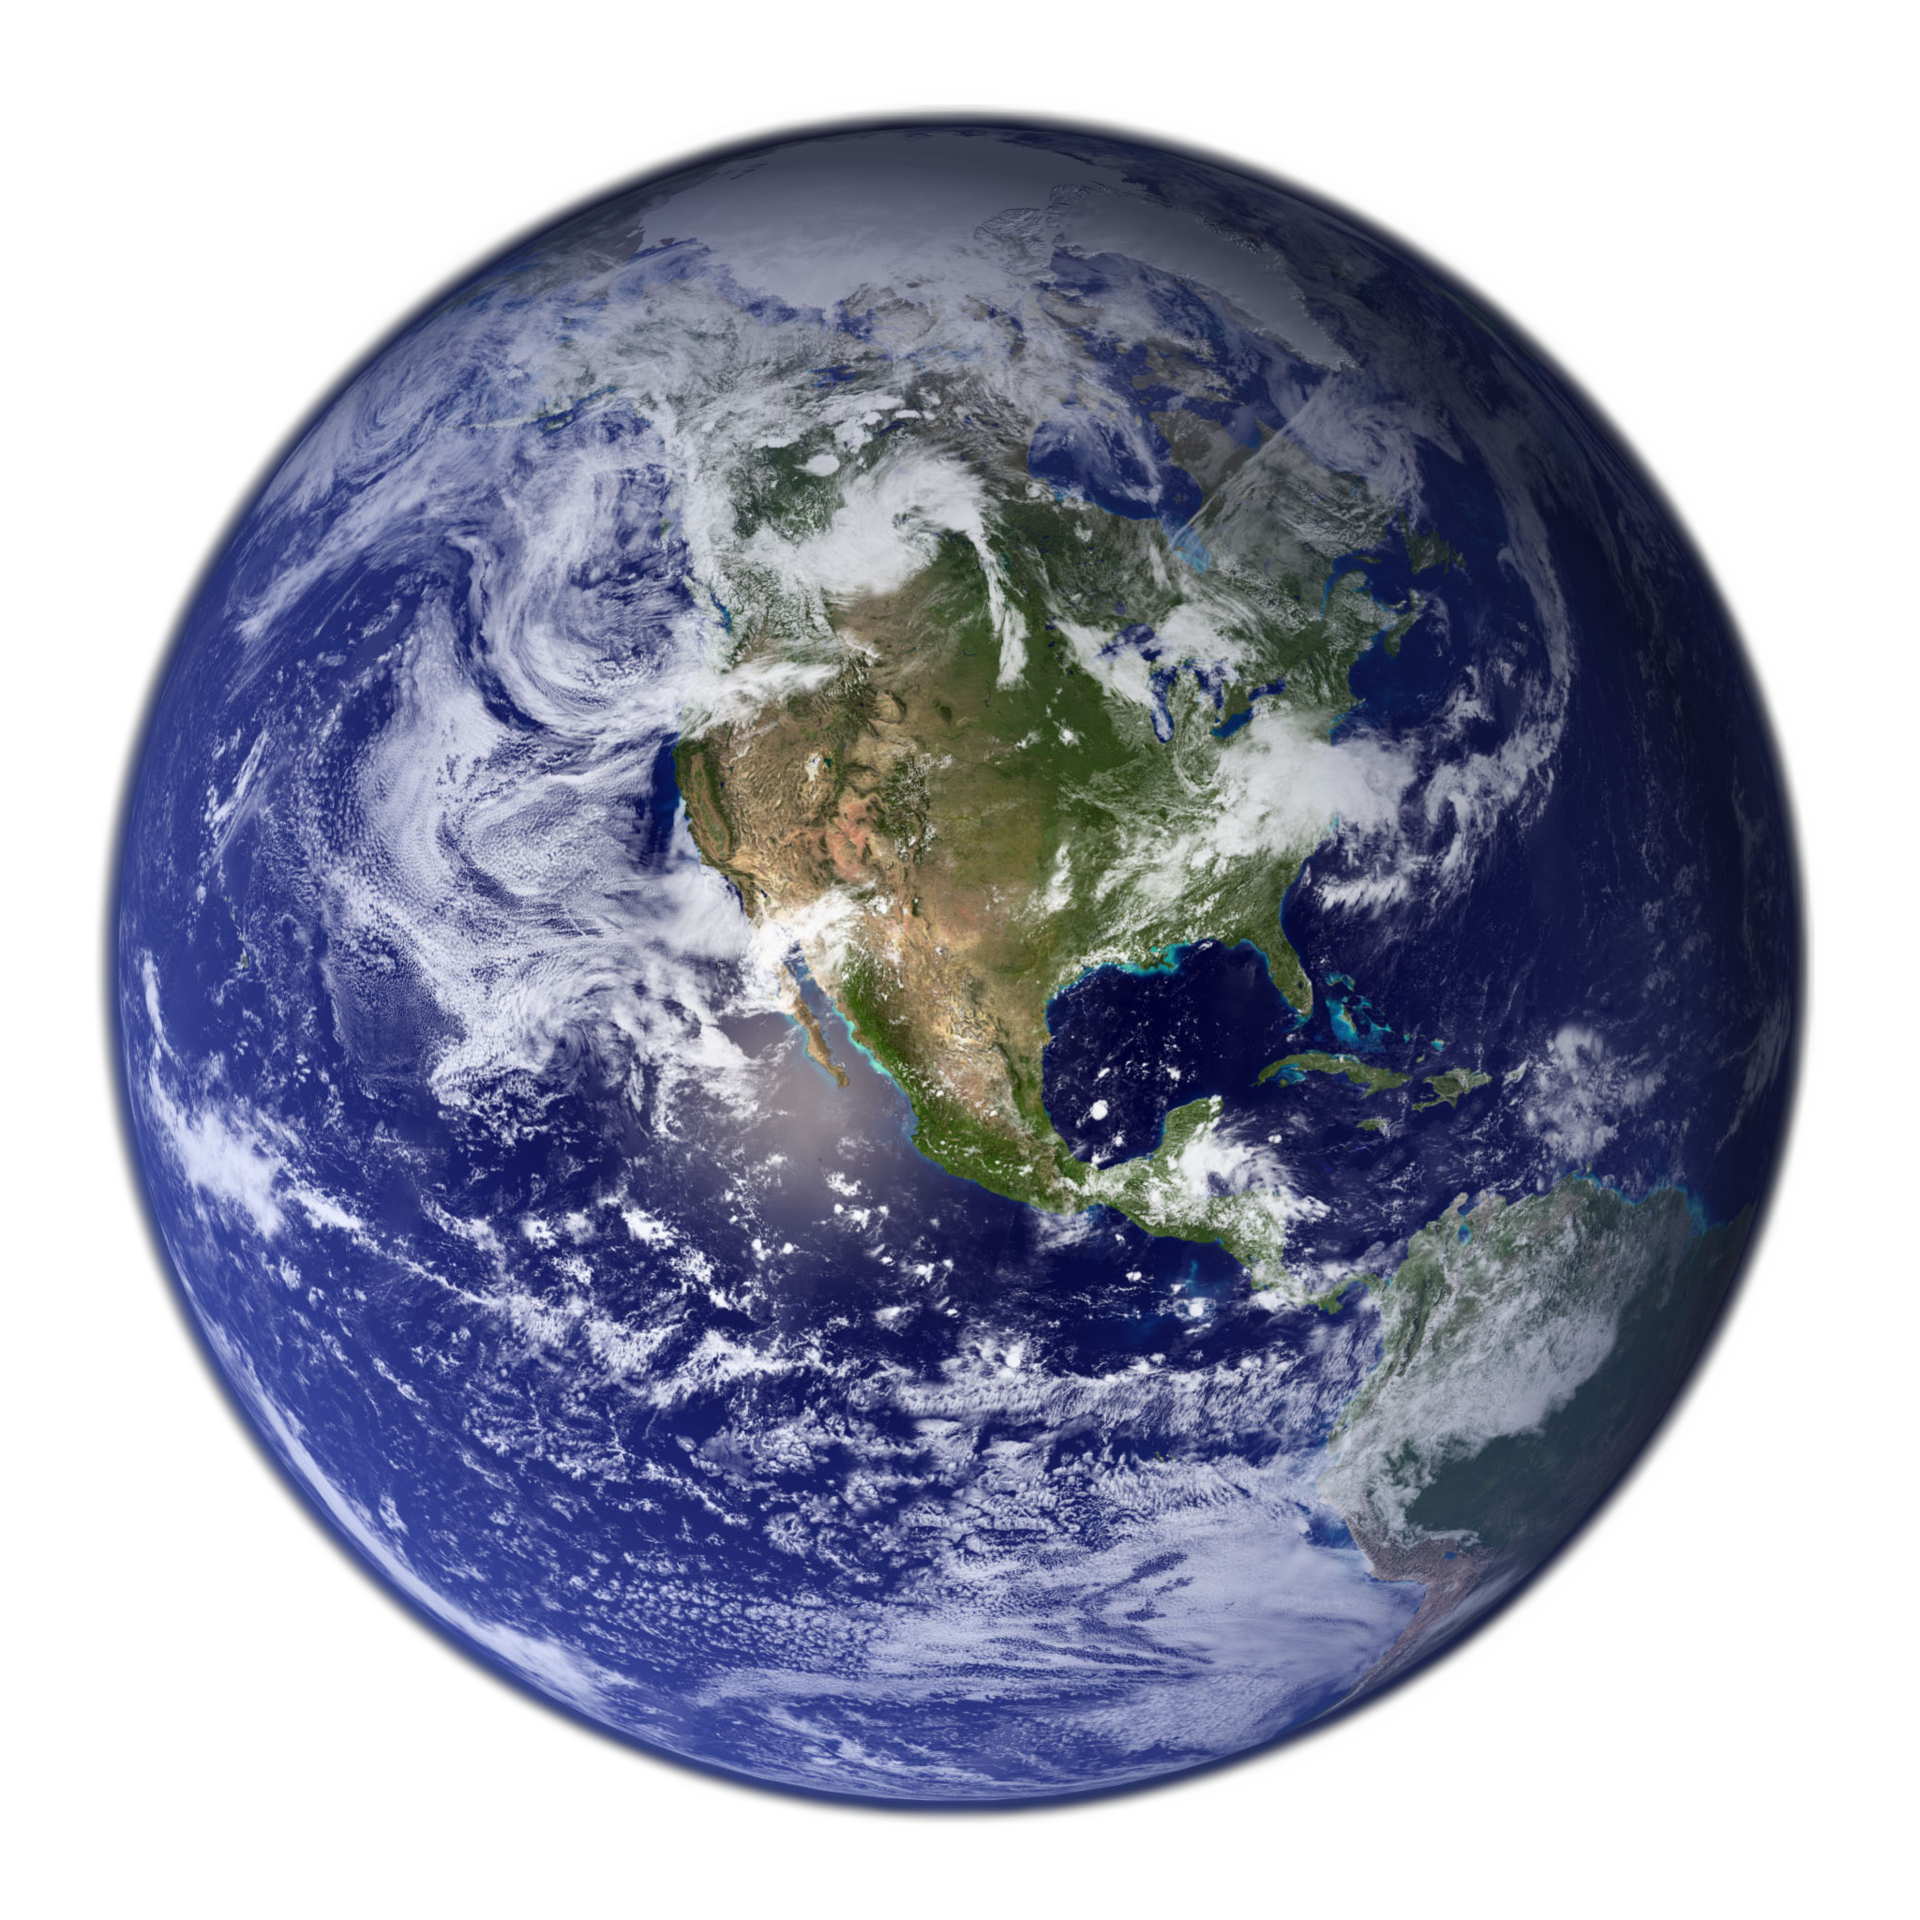
This is earth (figure 4.1). Earth is round. Earth is blue. Earth is watery. Jellyfish like.
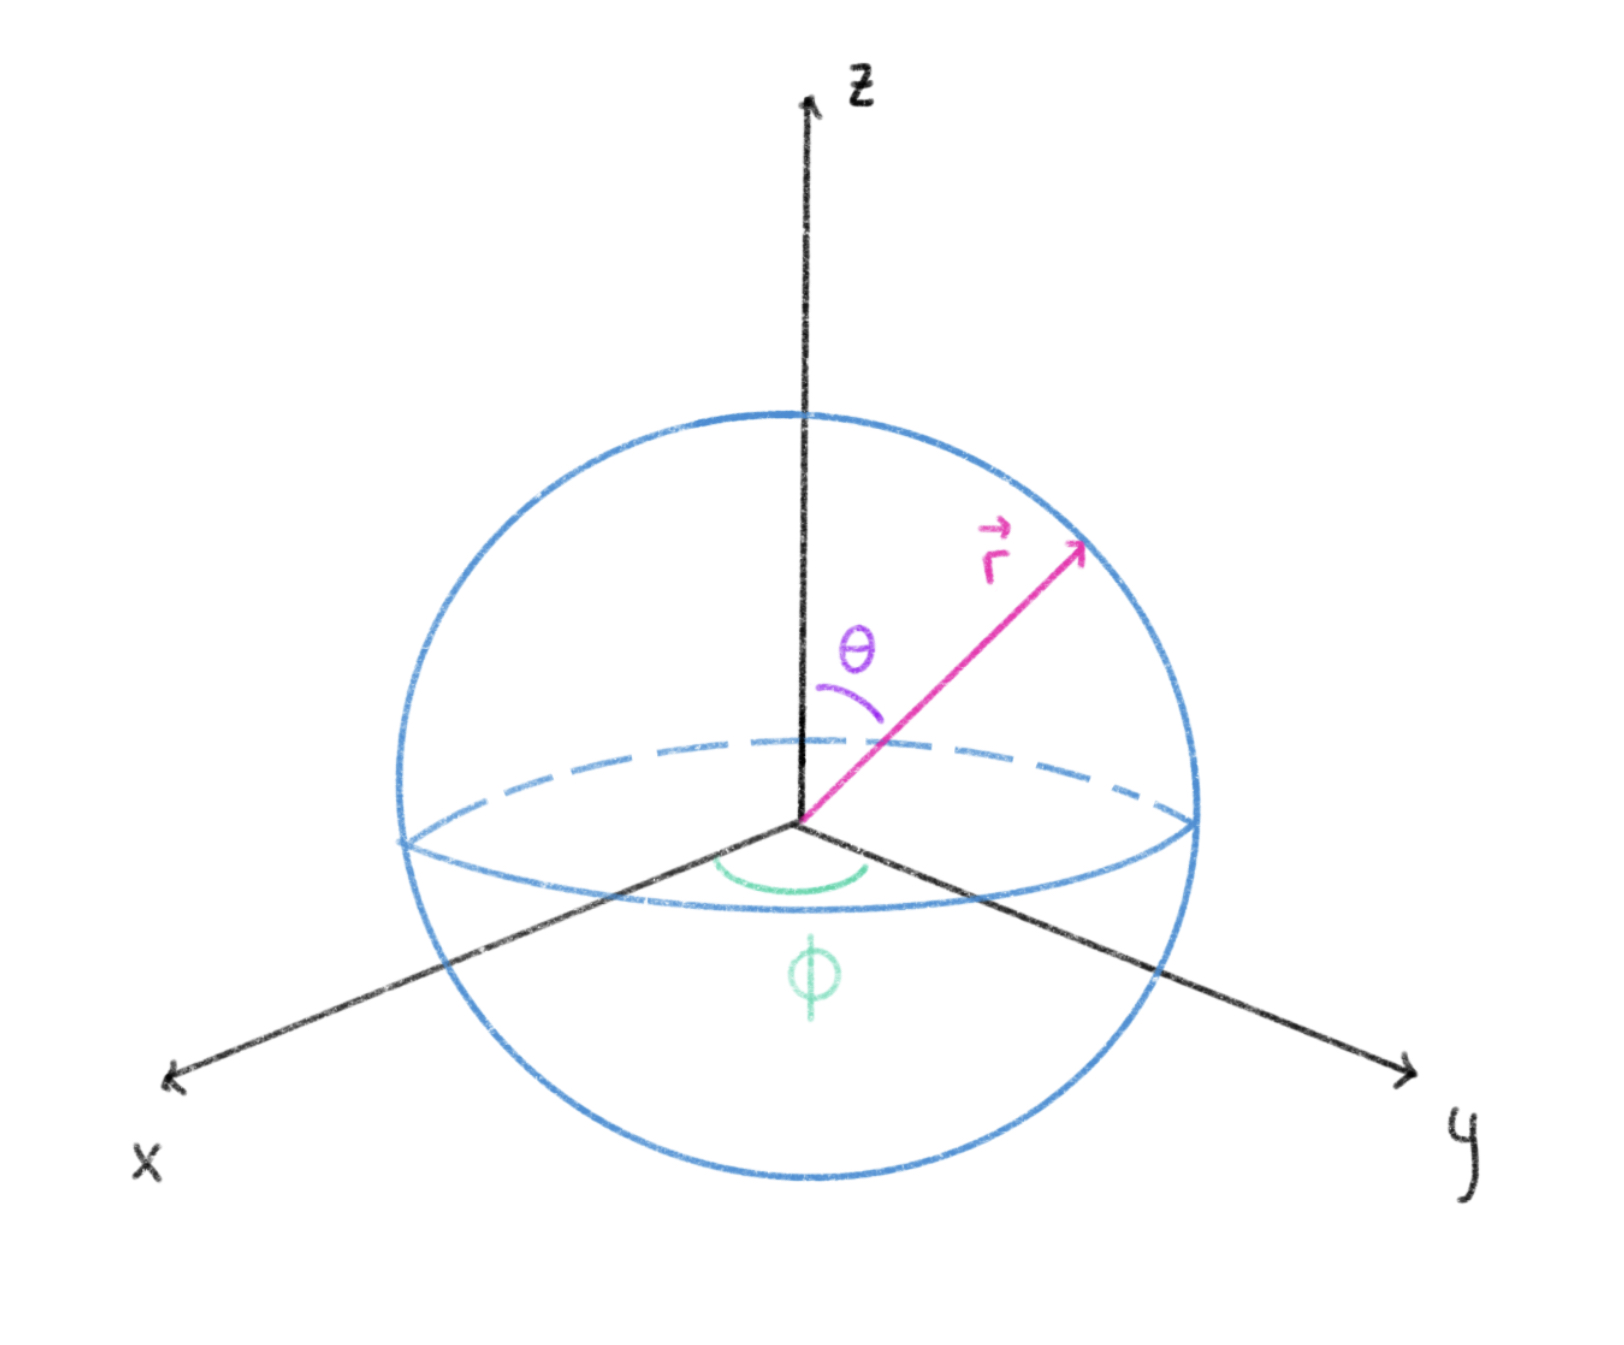
Earth can be described in spherical coordinates \((r, \theta, \phi)\) as seen on figure 4.2 marked in green, purple and pink. The ranges of the coordinates are
\(0 \leq r \leq \infty\) , radius of a sphere can be infinitely long
\(0 \leq \theta \leq \pi\) , theta moves along the dome on the upper half of the sphere.
\(0 \leq \phi \leq 2\pi\), phi rotates in the x, y plane
Imagine this: your satellite is floating peacefully in space. You want it to retrieve a photo from space. Satellite take photo. You receive a very nice photo, but there's one problem:
 Where on the sky is the photo from??
How do you compare this flat image, when all you have is a spherical map of the sky to compare with????????
WELCOME TO STEREOGRAPHIC PROJECTION where we take the spherical map and "smush" it to a flat map!
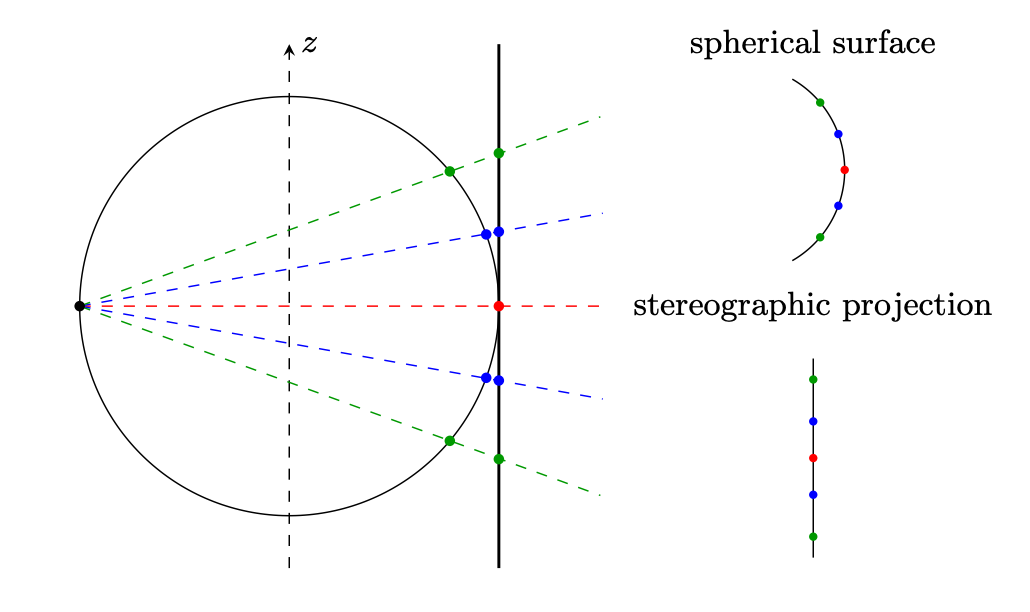
Figure 4.4 visualise the process. On the right hand side: we see the original spherical surface above. The left side show how we project every point of the spheric surface onto a flat surface, like projectors in school do onto a white wall. This projection will then be flat and we've created a flat map!
This process of creating a stereographic projection is essentially called a coordinate transformation which relate \((\theta, \phi)\) to \((x, y)\), said in math language.
Rebecca: TRANSFORMERS!
Karl: Not quite, but almost.
So our waffle making today consist of spherical image (the batter), the coordinate transformation (the waffle machine) and the outcome is a flat image (waffle). Let me rephrase the scenario once again, but this time describing stereographic projection.
You want a flat map. You get spherical map. This is not exactly what you wanted, BUT you can make it into what you wanted. You use a coordinate transformation and create a stereographic projection. Tada! A flat map!
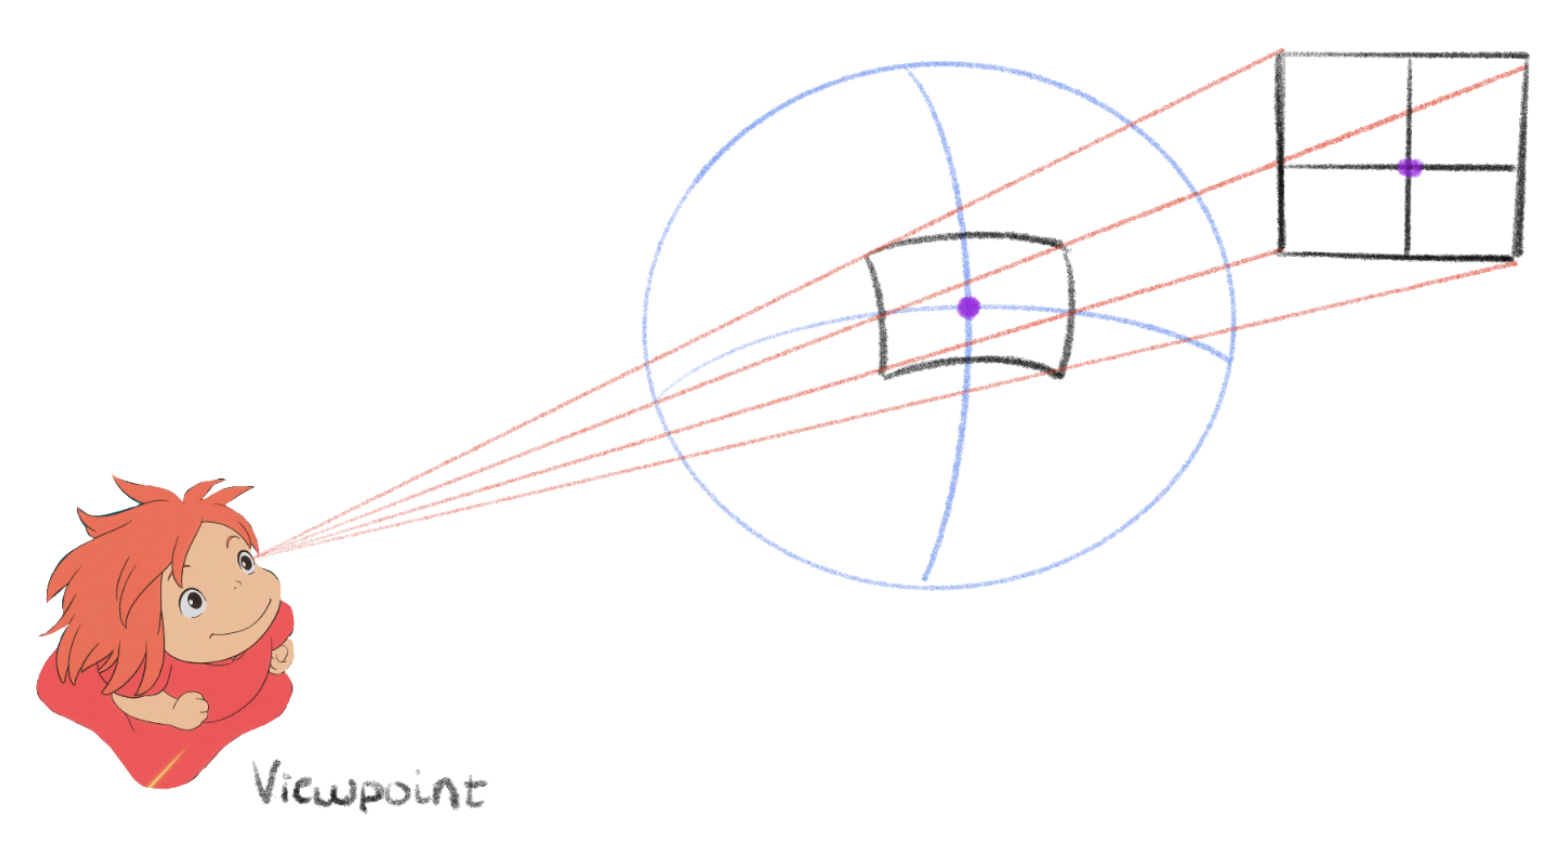
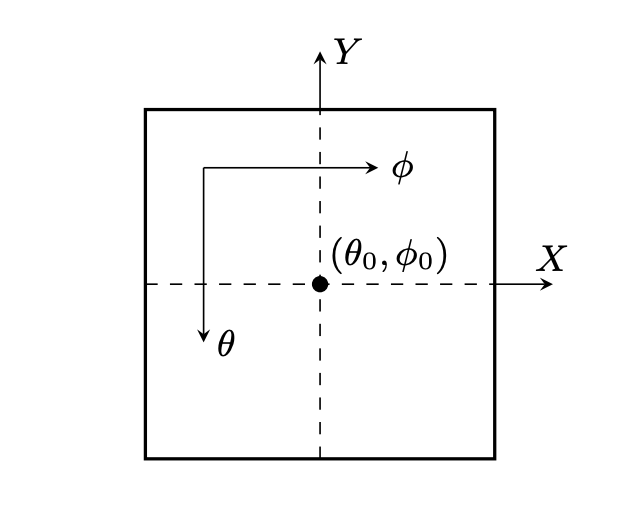
Figure 4.5 also illustrates the same as figure 4.4, but from a different perspective. Note how the image of the sphere's surface is like distorted and is then projected to a flat, straight image. Thank you Ponyo for your projection help! Figure 4.6 is the final projected image which is centered around \((\theta_0, \phi_0)\). The size of the image in direction of x and y is dependent on the ranges of theta and phi given by the sphere.
Now, let's introduce the method to do so.
On a normal camera, the boundaries of the projection is dependent on the camera's field of view. Where \(\alpha\) is the maximum angular width of the picture, which introduces new coordinate ranges on \(\theta \) and \(\phi\). With these limitations we can introduce equivalent limitations on x and y.
Karl: To the notebook!

*sweating*
Limitations on x and y are:
\(X_{max/min} = \pm \frac{2\sin(\alpha_{\phi} / 2 )}{1 + \cos(\alpha_{\phi} / 2 )}\)
\(Y_{max/min} = \pm \frac{2\sin(\alpha_{\theta} / 2 )}{1 + \cos(\alpha_{\theta} / 2 )}\)
It is hard to explain the process without it being to math-y, long and complicated. I suggest you check out our work if you are interested. Here you'll also find the equations on ranges of theta and phi ------> mathematical dungeon. If you don't want to fact check, then you just have to believe us.
How about recreating a reference photo to use all this theory? For detailed illustrated game plan, you can head over to the game plan dungeon.
TLDR (too lazy didn't read); For every pixel in our reference image we can calculate a theta and phi value which can be used to find a corresponding index on a file named "himmelkule" (himmelkule illustrated in game plan dungeon. It is a spherical map :). From this index, himmelkule gives us a rgb value (RGB values will be explained further down). With all these rgb values we can recreate the reference image.
Did this make sense? No? You know where to go then --> game plan dungeon
Enough talking, time for action!

-
-
-
-
-
-
-
-
-
-
Are you ready to have a look?
-
-
-
-
-
-
-
-
-
As you can see, we successfully recreated the reference image!! Hurray!!
Hmmm... we can actually use the same theory and code to create a POV (point of view) of our satellite rotating in space, only by varying the angle phi from 0 degrees to 360 degrees and create 360 flat images. If you are unsure of what phi is, please check figure 4.2
Every image in this video (all 360 images) are named after the angle of phi they represent. I shall name this video 360 view.
Comment: Just realized it is spinning in the wrong direction? Phi moves horizontally but the video shows a vertical movement. Oh no, I do not know what went wrong.
In what way can everything we've done so far, be useful?
With this software we can always determine the direction we're facing in space based on a photo from the it. Since we just mapped out the satellites surroundings, we can just compare the photo with our 360 view (the reason we can do so is because our 360 views are flat images, they are not spherical). The part of sky in our 360 view which matches the most to the photo taken by the satellite determines the angle phi our satellite is facing!
There are several ways to compare two images. We will approach this problem by using the least square method. Why? It is very simple:
\(\Delta = \sum\limits_{i}^{360} \left[RGB_{satellite} - RGB_{360 view} \right]^2\)
Hmmm... not so simple. Allow me to explain this equation with words. This method takes two photos, in our case: satellite photo and 360 view. For every photo in 360 view, the method goes through every pixel and compares the error and add up the errors per pixel. This gives us the total deviation between satellite image and one of the 360 images. It does so for all 360 images and the image which deviates the least from the image from our satellite is most likely the angle phi we are looking at. It is a simple method doing one thing and one thing only: compare for deviation, which is essentially everything we wanted to check for anyways.
Got it? No? Think of it as a game of find the error.
Your computer is able to spot every error. For every image in 360 view that is compared with satellite photo, the method will spit out the amount of errors spotted. The 360 view image which has the least amount of errors compared to the satellite image, is the phi angle we are looking for. Figure 4.10 has two errors. If there's another image which only has one error, then that image would be more accurate.
The so called "errors" we measure is a difference between the RGB values of the two images.
You: RG-what??
RGB - red, green and blue. Each colour is represented by a number ranging from 0 to 255, like levels. Meaning there are 16777216 possible colours that can be created from values of RGB.
For example, I created this blue colour with levels 68 of red, 199 of green and 244 of blue. Pretty cool right? Ps. your printer works just like this too!
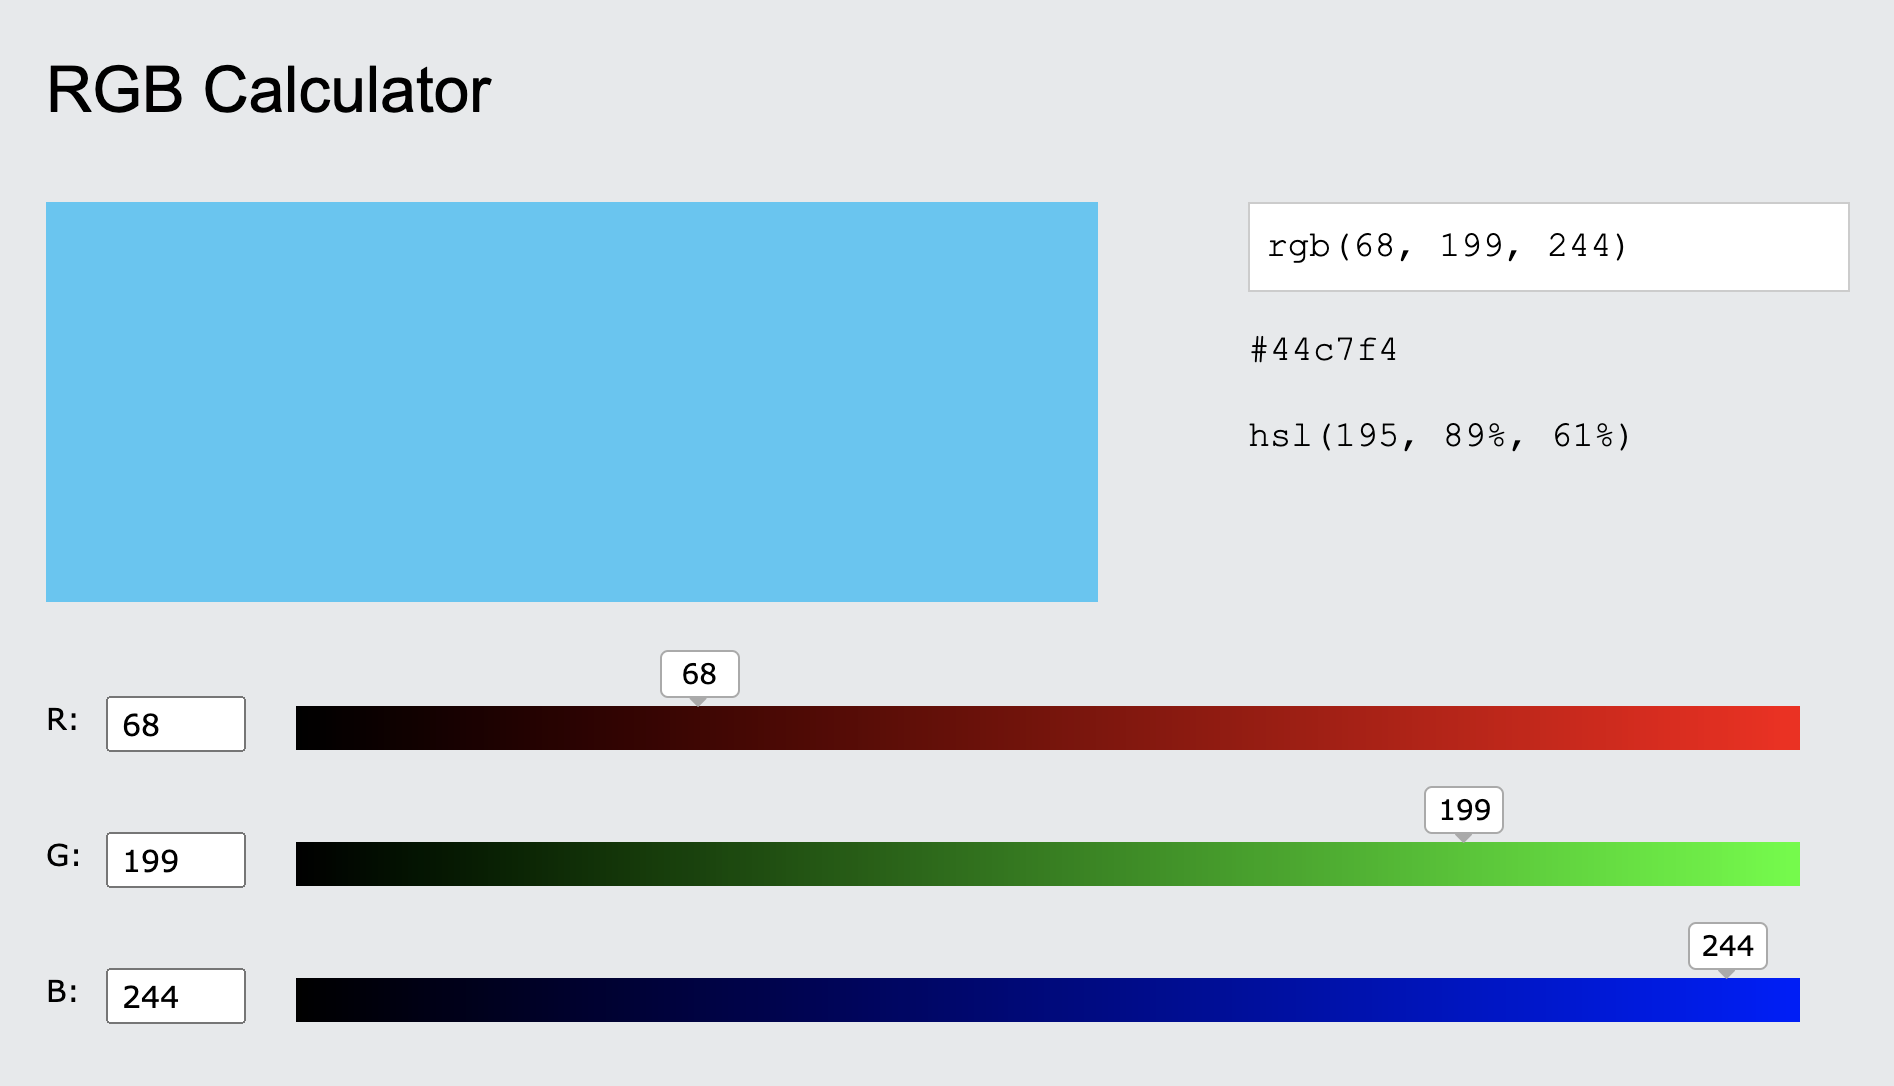
You too can do the same with the RGB calculator!
We've now constructed the part of software for orientation. Anything else missing?
1: https://unsplash.com/photos/o6k0ZH1eOwg
2: Project part 4 [page 1]