Cruise report
The data from the cruise are finally ready and you can now start doing the analysis for a cruise report. The instructions are given in this document (note that a task involving comparison with MET's ocean models have been taken out). The report is due Friday 3 November. You are allowed to collaborate on this, but we expect a cruise report from each student.
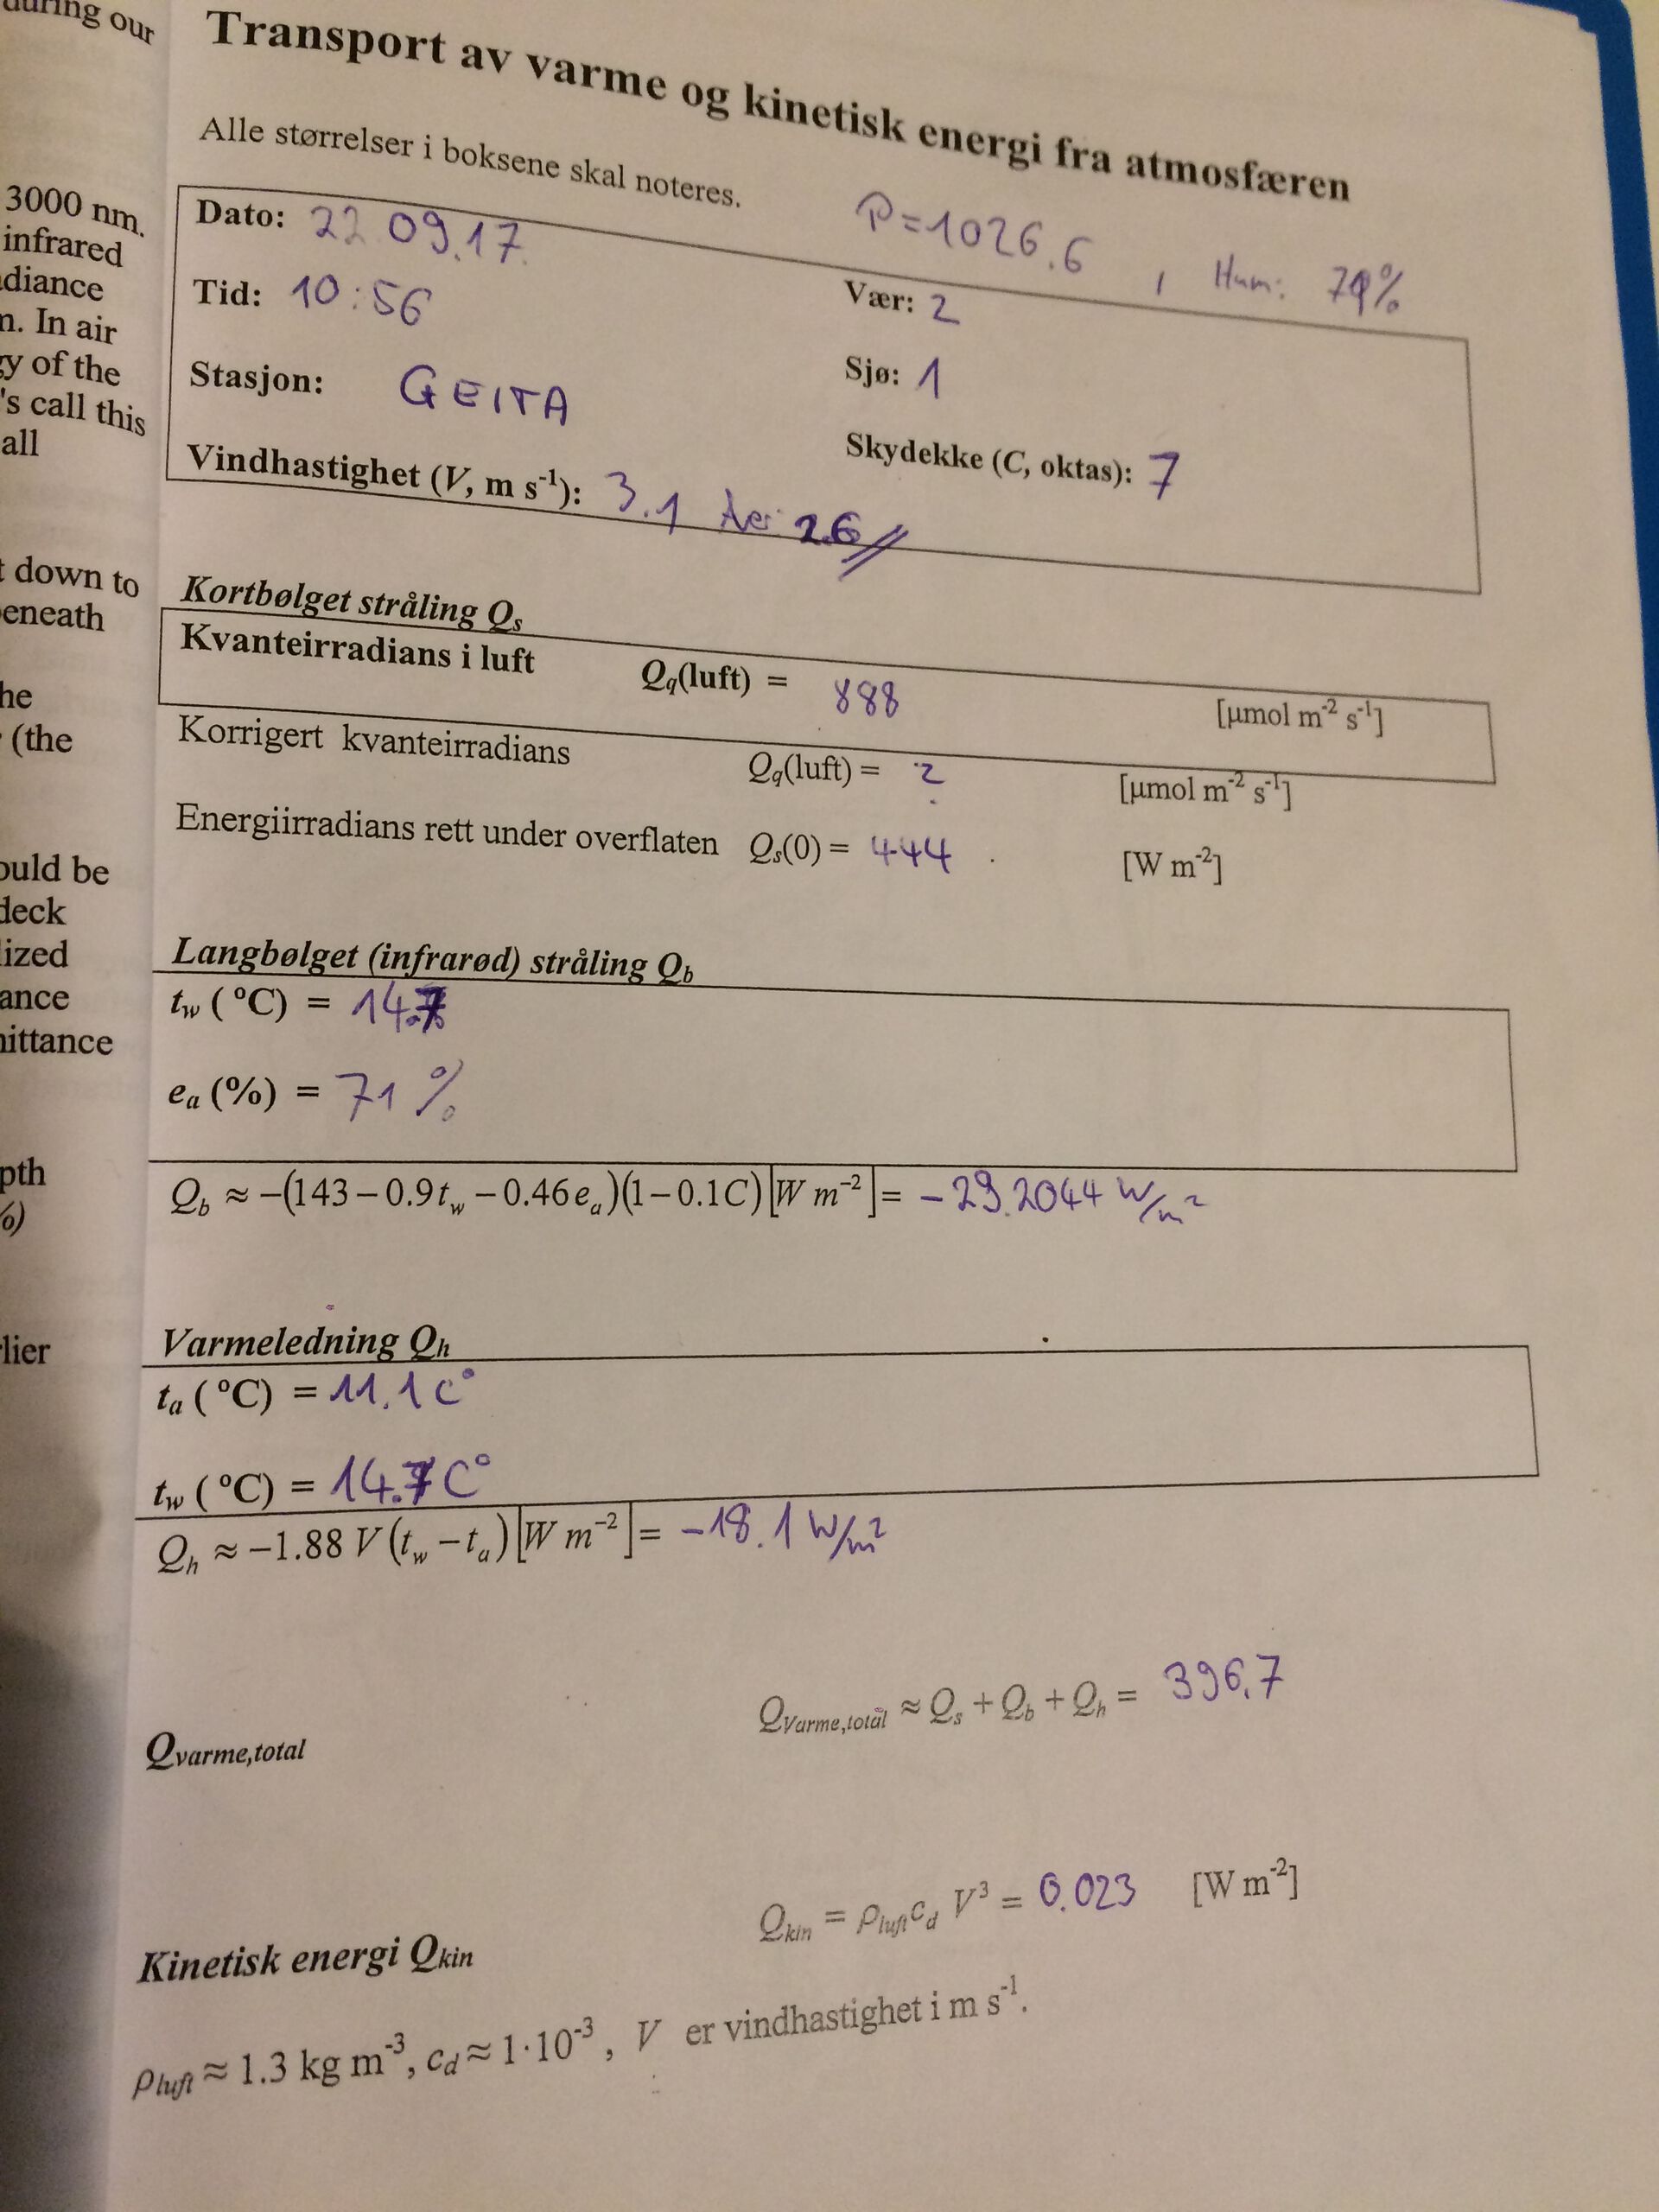
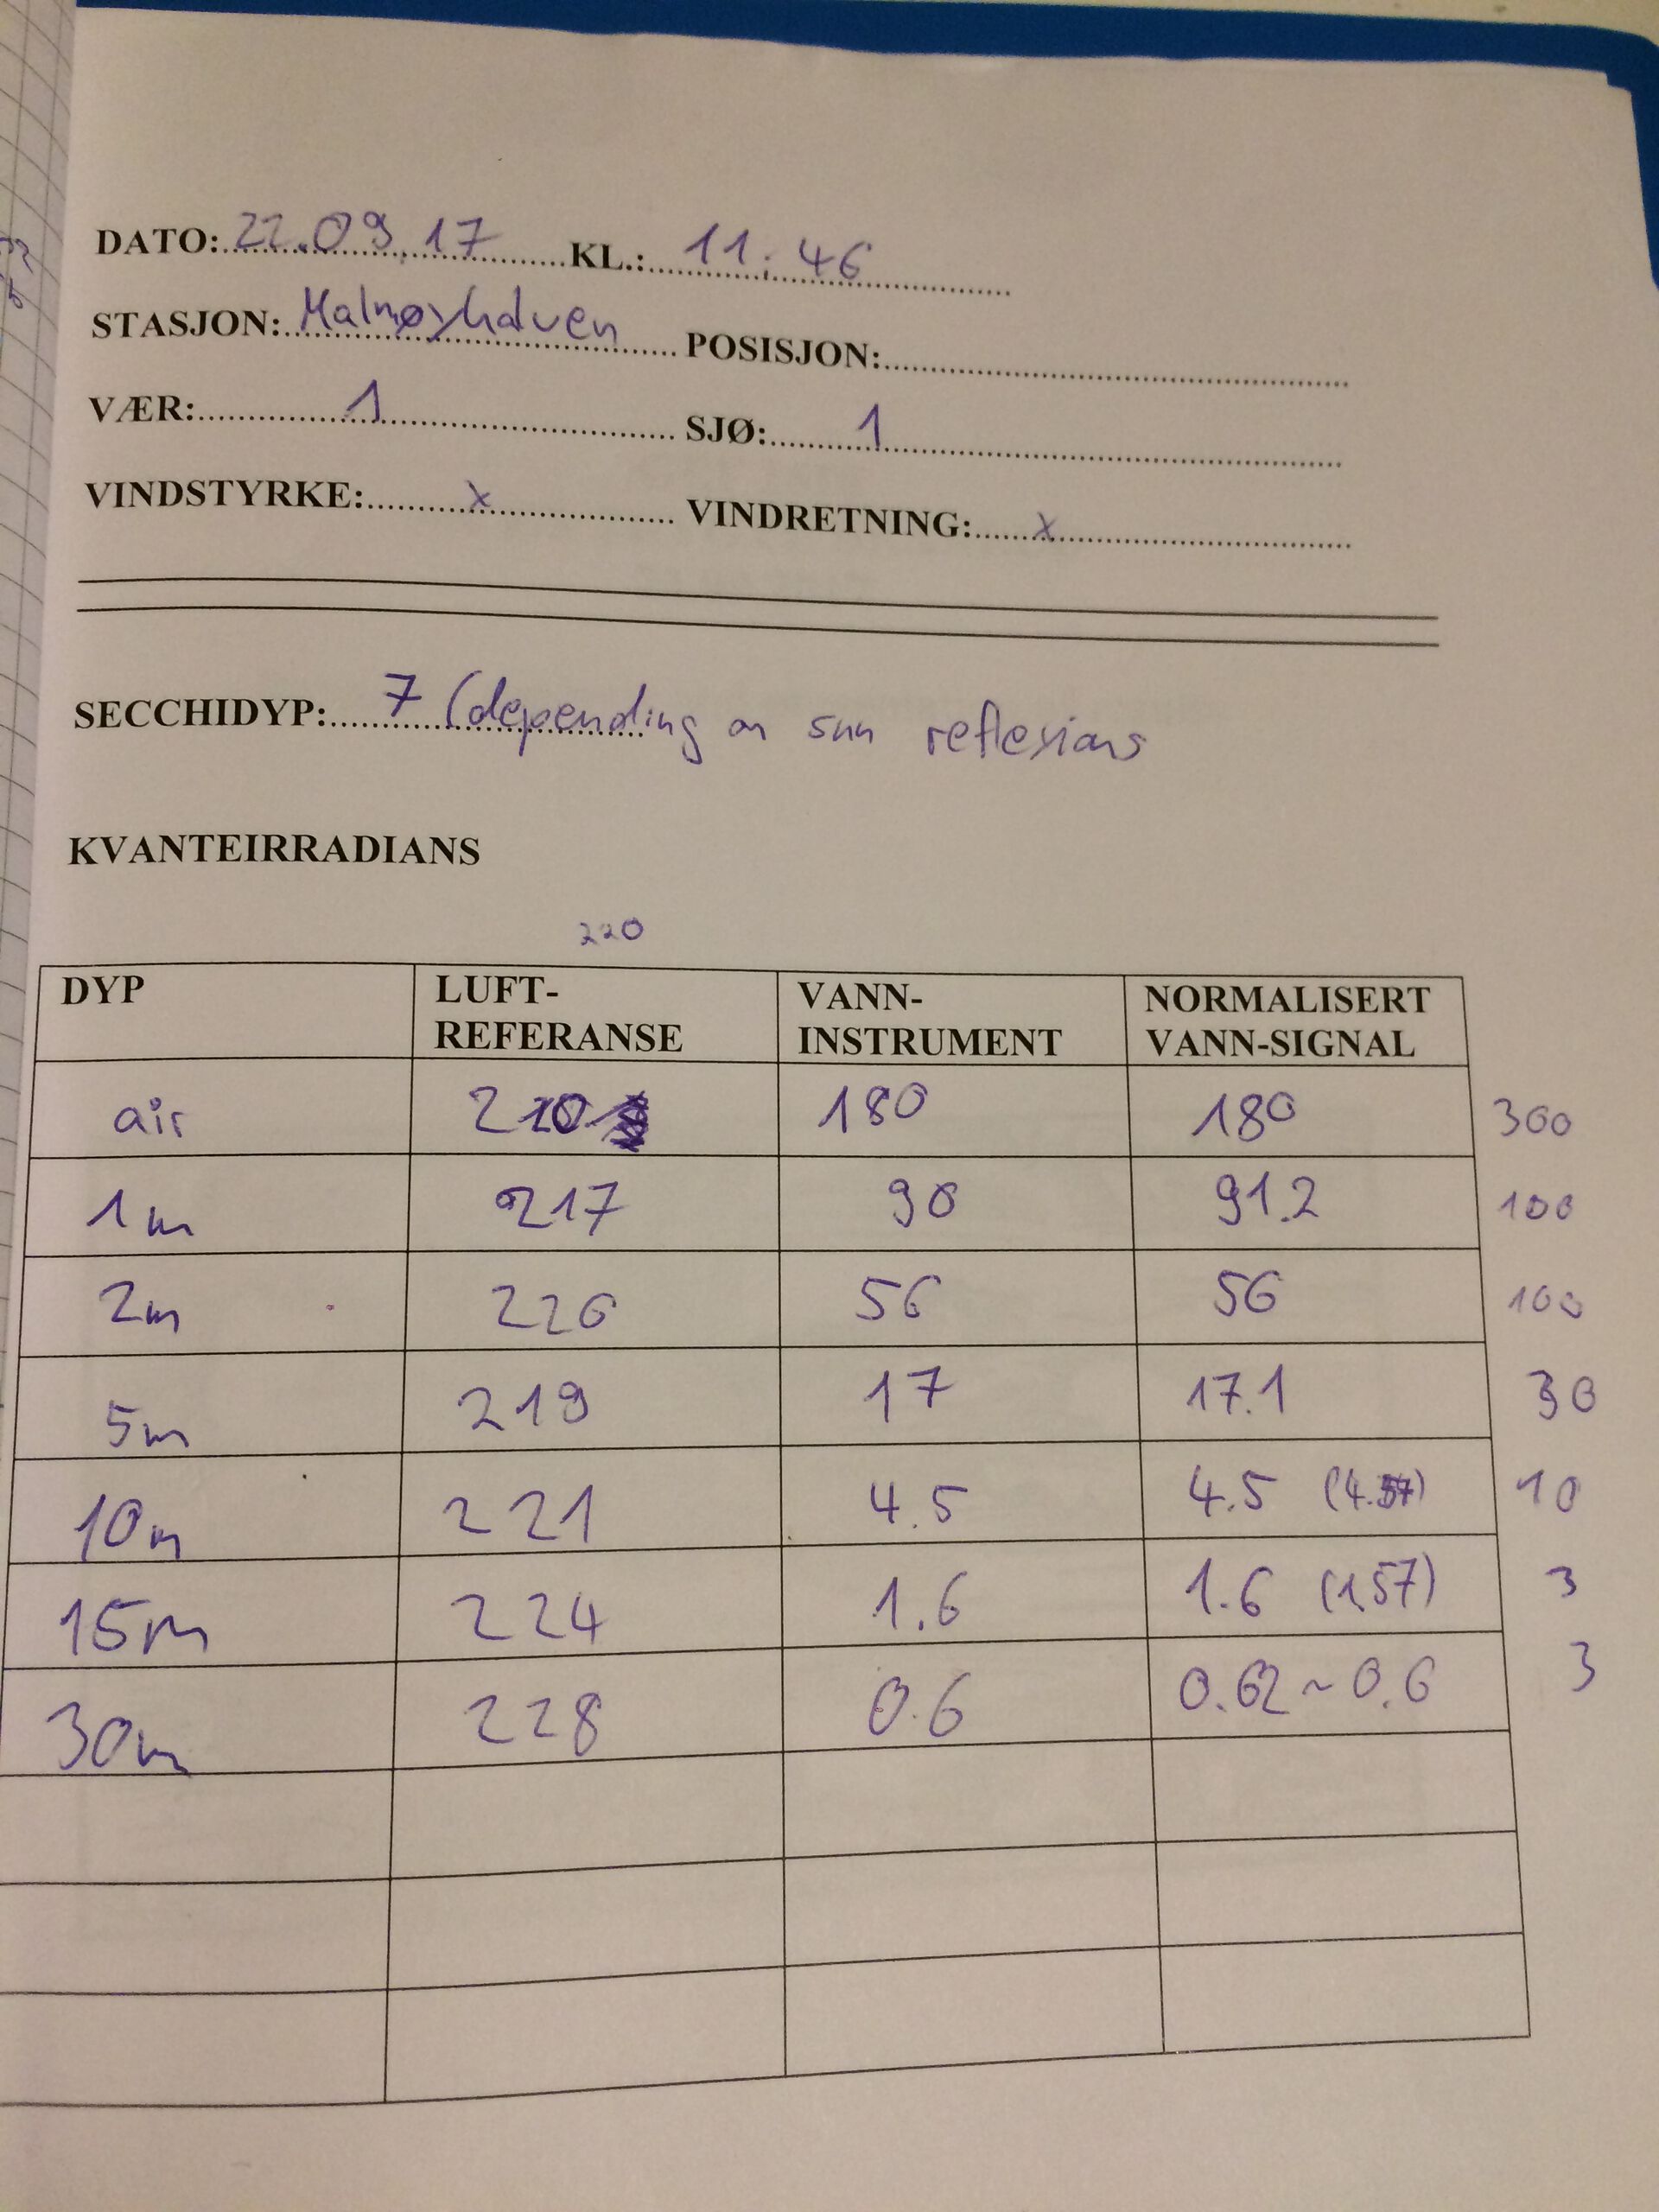
The flux and optics data from the three groups were handed in using different formats, but here they are:
The CTD data from the three stations (Oksvaldflua was sampled twice) are stored in .csv files (that can be read into e.g. Excel, Matlab, etc.). The four datafiles are:
Good luck!
Pål E.
Publisert 20. okt. 2017 21:55
- Sist endret 7. feb. 2020 15:53