Pre-Lab Questions for KJM 5900 Exercise 5
Return to: KJM 5900 Main Page | List of Exercises Page | Exercise 5 Page
Questions:
- Explain how the decay rate of a nuclide relates to the irradiation time (Gjør kort rede for hvordan desintegrasjonshastigheten til en dannet nuklide avhenger av bestrålingstiden)
- Calculate the neutron flux of fast neutrons at a) 10 cm and b) 50 cm from the source. The source sends out 3·107 neutrons per second. Assume that there is no absorption. (Beregn nøytronfluksen 10 og 50 cm fra kilden.)
- How many grams are 450 GBq of 238Pu? (Hvor mange gram 238Pu tilsvarer 450 GBq)
- Use e.g. your nuclear chart to find out which nuclides are produced when you irradiate natural silver with neutrons (Hint: two isotopes will be produced, each with two different isomers). Write down the reaction equations, half lives of the products and thermal neutron cross-sections. (Hvilke nuklider dannes ved bestråling av sølv, gi reaksjoner).
- In the laboratory exercise only two of the four products you found
in your answer to questions 4 will contribute to the measured count rate.
Why?
Exercise
In the laboratory exercise we ask you to "deconvolute", i.e. separate, the composite decay curve for the two main components you produce in the irradiation (see question 4. and 5. above). To make sure you properly understand how to to this we require you to do the calculations backwards:Assume you produce the two components you found (in your answer to questions 4 and 5 above) in such amounts that
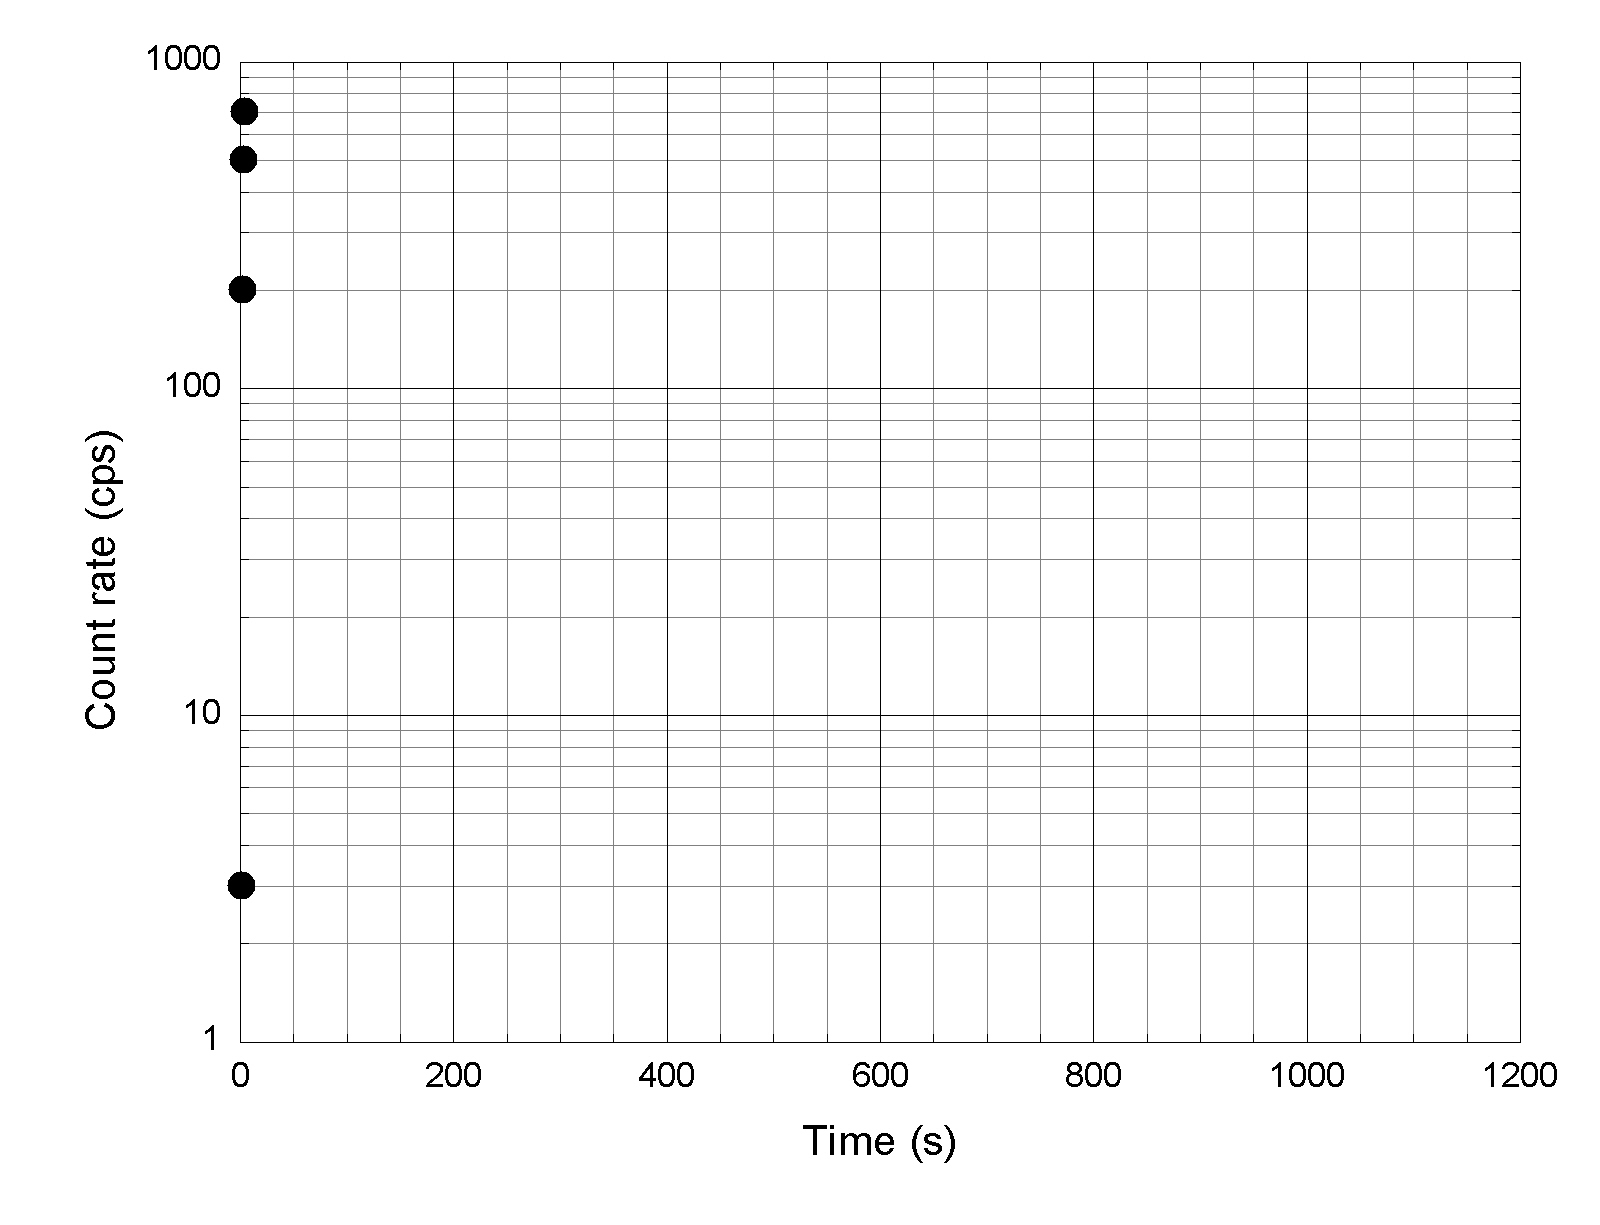
- The shorter lived component have an initial count rate, R0(A), of 500 cps
- The longer lived component have an initial count rate, R0(B), of 200 cps
- In addition, the background in your counter is 3 cps.
When you measure this you do of course not know how many counts to attribute to each component and to the background - all you know is that your counter sees 730 cps. What you need to do is to measure how the count rate changes with time and then use your knowledge about radioactive decay to analyse this curve. This is what you will do in the laboratory exercise. Here we will do it backwards in order to learn how the three different components (A, B and background) contribute to the measured decay rate as a function of time:
Step 1: Make a table like the one below
| Time after irradiation (s) |
0 |
30 |
60 |
90 |
120 |
200 |
500 |
800 |
1600 |
| Count rate of A (cps) |
|||||||||
| Count rate of B (cps) |
|||||||||
| Background (cps) |
|||||||||
| Sum (cps) |
Step 2: Use the correct half lives for the two components and fill in the table.
Step 3: Use logaritmic paper and plot the decay curves for each of the components. Also draw a horisontal line representing the background. Then plot the sum. Here is suitable logaritmic scaledplots on which you can draw your curves: PDF format, JPEG format, Origin format (for the Origin file you must right click and select "save link as.." or something similar). The points for time = 0 have already been added to the plot. Remember that for a exponential decay the curve will be a straight line. However, this is not true if you have multiple components (e.g. one ore more nuclei + background).
Step 4: As you can see (if you have done it correctly), the sum (which is what your detector measures) in the right half of the plot are not influenced by the short lived component. Thus, we can use this part of the table/plot to find the amount of the long lived component B! What you need to do in the laboratory exercise is to subtract the background from the sum and plot these points. In the right side of the plot you will then get a straight line equal to the line for component B. By extending this line to time = 0 you can get R0(B) by finding the point where this line crosses the y-axis. In the plot you submitt to your supervisor point out the following:
- The line you shall use to fing R0(B).
- Where you will find the R0(B) value.
- The line you shall use to fing R0(A).
- Where you will find the R0(A) value.
The answers to these questions and exercise must be approved by your superviser before you start doing the laboratory exercise. Please make sure you have understod completely the purpose of the exercise before you start (otherwise you should ask!). Good luck!
Last updated 19. October 2005 by Jon Petter Omtvedt